Grouping Data and Histogram
Grouping Data and Histogram: Overview
This Topic covers sub-topics such as Class Interval, Difference Between a Histogram and a Bar Graph, Grouped Frequency Distribution, Continuous Frequency Distribution, Characteristics of a Histogram and, Histogram of Grouped Data
Important Questions on Grouping Data and Histogram
Prepare a continuous frequency distribution table by taking a class interval of from the following data.
Construct a frequency distribution table for given data:
The marks of students of a class are given:
Construct a frequency distribution table.
The age of members in a Yoga Institute are given:
If number of classes is , identify the width of each class.
The marks of students in a class is given:
Identify the width of each class if number of class is
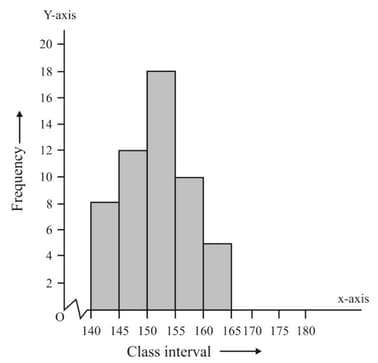
Identify the scale used in the histogram given below.

Write any one difference between a histogram and a bar graph.
A histogram is drawn for discrete data.
Here are the ages, (years), of people in a cinema.
Show the data in a frequency table with these class intervals: and
Show the data in a frequency table with these class intervals: and
Compare the table and identify which is the best way to represent the data.
Write your answer with reason.
Julian runs a bookshop. The table shows the number of books purchased by each of his last customers.
| Number of books | ||||||||||
| Number of customers |
Calculate the median number of books purchased by these customers.
Henri plays a game over and over again. On each attempt, he gets a score of between and . These are his scores for his first seven attempts : . Henri plays the game an eighth time. What is his score if the mean of all scores is .
Calculate the mean mark for the data in the table.
| Mark | Frequency |
Write your answer up to two decimal places.
The weights of students of a class are
Prepare a frequency distribution table using one class interval as , in which is included and excluded. Which class interval has highest frequency.
The ages (in years) of patients treated in a hospital on a particular day are given below:
| Age (in years) | ||||||
| Number of patients |
Which age group has the highest number of patients.
The following table shows the number of illiterate persons in the age group ( years) in a town. How many illiterates are there in the age group .
| Age group (in years) | ||||||
| Number of illiterate persons |
Find the size of the class interval:
Find the size of the class interval in the following caes.
Find the size of the class interval.
Draw a histogram and hence estimate the mode for the following frequency distribution:
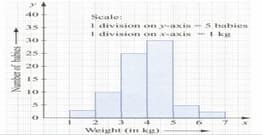
The histogram below shows the weights of newborn babies:

Find the ratio of the number of babies weighing or more but less than , to the number of babies weighing or more but less than .
